Ny-Ålesund Campaign on Svalbard April 2016

CIRFA team members from Norut, NTNU and the Norwegian Polar Institute (NPI) are now back from a field campaign in Ny-Ålesund on Svalbard that was carried out in April 2016.
Data was collected to meet data requirements from the following CIRFA Work Packages: WP2 Sea-ice and Iceberg properties, WP4 RPAS technologies for operation under arctic conditions and WP6 Field work. Beyond the CIRFA SFI, the activities are also part of the project Arctic EO, the Fram Centre project Mapping Sea Ice (Fjord and coast flagship), and the long term Arctic sea ice monitoring of the Norwegian Polar Institute. The field measurements and satellite recordings are completed, and the work with data and samples starts or goes on for the coming months, before results can be discussed in more detail, and eventually can be published. The report below gives an overview of the activities and data collected during the campaign.
See also the video from the Ny-Ålesund campaign.
Report from CIRFA related activities at the April 2016 field campaign
Rune Storvold1,2, Sebastian Gerland3, Jean Negrel3, Stian Solbø1, Tom Rune Lauknes, Line Rouyet1, Agnar Sivertsen1, Andreas Tøllefsen1, Kjell-Sture Johansen1, Tore Riise1, Nils Håheim Saers1, Tor-Arne Johansen2, Kim Sørensen2, Lars Semb2, Pål Kvaløy2, Fredrik Leira2
1Norut, 2NTNU, 3Norwegian Polar Institute (NPI)
Data collected
Daily Radarsat 2 quad (full) polarization fine mode (25 km x25 km, 10 m resolution) satellite data from ascending passes covering Kongsfjorden in the afternoon from April 14-18 were ordered from KSAT, a quick look is displayed in Figure 1. In addition data from Sentinel-1 will be available (Dual Polarization HH-HV, 70m resolution) example of HH image from April 17th pass is shown in Figure 2.
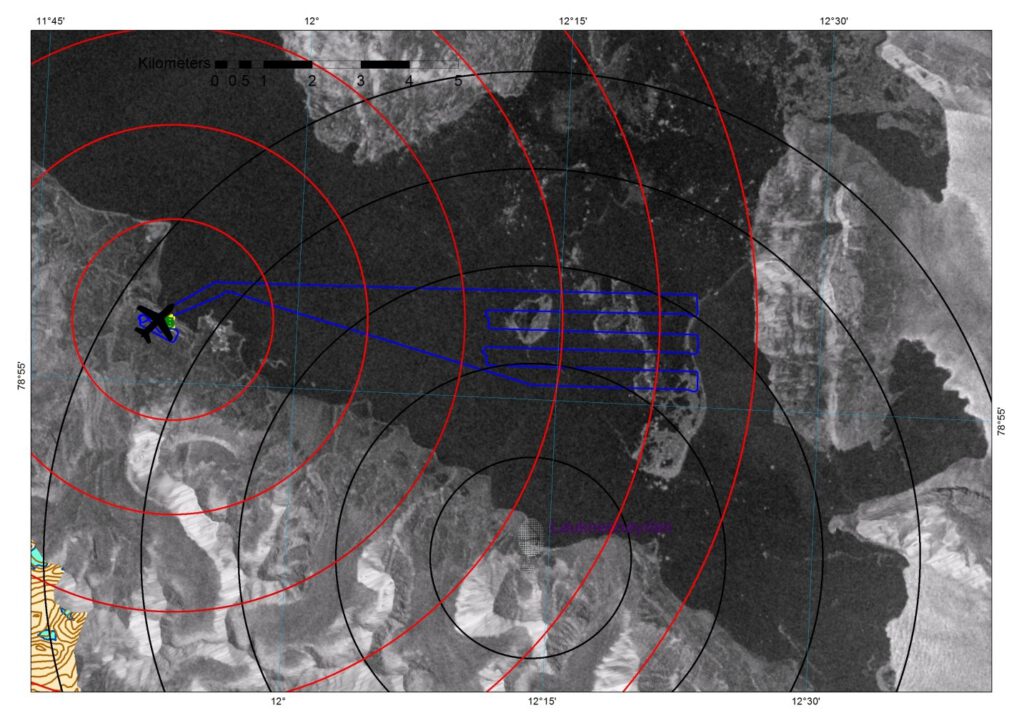

The Norut GPRI radar was installed on” Laukneshøyden” as indicated on the map in Figure 1. The GPRI data collection started at 17.15 on April 15th local time and continued to April 19th at 10.00 local time (UTC+2). The radar conducted one sweep every 2 minutes with only one interruption of 4 hours in the early morning of April 16th.

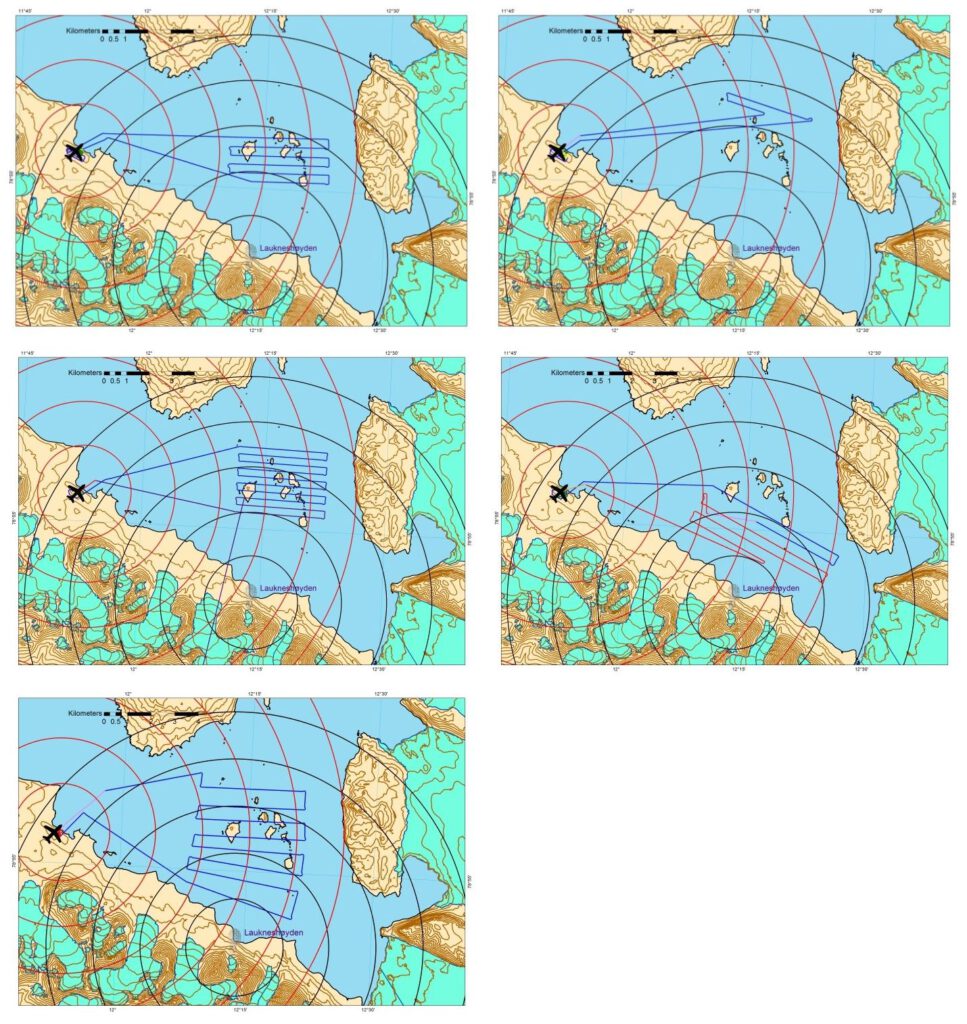
The Norut RPAS team conducted five sea-ice and Iceberg mapping missions as part of CIRFA and Fram Center projects and two snow mapping mission connected to the Arctic EO project and one initial test mission for the new communication and sensor control system. The mission varied from 30 to 70 km in length. The five ice missions are shown in Figure 4. The RPAS was instrumented with two Canon EOS M cameras, both running the Magic Lantern firmware and one running in video mode and the other in still photo mode. Still camera was triggered by the autopilot every 50 meter and image capture time logged by monitoring the flash shoe pulse.
The NTNU RPAS team conducted several test flights with the communication and Neptus and Dune sensor feedback navigation setup. When this was verified flights with a gimbaled IR camera for tracking of icebergs was successfully flown and also several flights were conducted with the icing protected testbed RPAS to test the novel intelligent icing protection solution. Flight tests were conducted to test anti-icing and de-icing performances, while other flights were allocated to investigate a state-of-the-art icing detection algorithm. All icing protection solution test flights were flown VLOS at altitudes ranging from 150m to 450m.
The IR camera payload was used to automatically detect floating icebergs using onboard and real-time computer vision algorithms. After successfully detecting icebergs in the ocean, the payload’s path planner was activated in order to make the plane keep track of the located iceberg.

The team of the Norwegian Polar Institute collected in situ data of sea ice physical properties on nine ice stations in the inner part of Kongsfjorden between 12 and 17 April 2015 (see map in Figure 6). Stations were accessed from Ny-Ålesund with a relatively small open boat (Polarcircle 580). Properties that were measured included sea ice thickness, snow thickness, freeboard, temperatures in air, snow, ice and water, salinity in snow, ice and water. Where snow was found, a snow pit with basic snow properties was made. In addition to the measurements, ice samples were taken for later textural studies.

The sea ice in Kongsfjorden was thoroughly thin ice with thicknesses under 20 cm. Snow covering the sea ice was only found for one of the stations. It is interesting that several different thin-ice classes could be met, to be later compared with how the show up in the Radarsat-2 quad-polarization images and optical satellite products, obtained parallel to the in situ work. The work was done either standing on the ice (see Figure 7), or directly from the boat, depending on what ice thickness and properties allowed.

On the way to and from ice stations, on several of the days drifting as well as grounded icebergs were mapped by circumventing them with the boat, having a GPS tracker on. The actual icebergs were also photographed (see example in Figure 8). The background for this mapping is to provide additional validation data for iceberg detection from satellite, UAV flight photography, and a coastal radar system, that was installed by the Norut team during the same week at the southern shore of inner Kongsfjorden.

While field measurements and satellite recordings are completed, the work with data and samples starts or goes on for the coming months, before results can be discussed in more detail, and eventually can be published.